Cell subsets
A browser can draw a few hundred thousand points; a dataset with millions of cells would make every plot slow and every focus change a large download. AnnZarro therefore shows large datasets through a cell subset: a reproducible sample of the cells that every panel, table, share link and panel set uses. The subset is decided on the server from a short description (number of cells, seed, optional balancing and filter), so the same description names the same cells on every machine and in every release.
The default
A dataset with more than 200,000 cells opens on a subset of 100,000 cells with seed 0.
At or below 200,000 cells every cell is shown and nothing changes. The three numbers are server
settings: ui.defaults.subset_threshold, subset_size and subset_seed
(Configuration).
The statistics bar under the header says which cells are shown:
Every cell is shown: the badge reads All cells.

A subset is active: Cells: 3,000 of 8,090 and the badge Subset · seed 0.
Hover over the badge for the details, for example “Showing 3,000 of 8,090 cells (seed 0, balanced by Age, n_genes_by_counts ≥ 1000). 8,063 cells pass the filter. Every panel shows these same cells. Click to change the subset.”
Choose a subset
bm_aging.zarr has 8,090 cells, so it opens on all of them; the subset below is chosen by hand to
show the dialog. On a large dataset the steps are the same.
Click the badge (All cells or Subset · seed …). The Cell subset dialog opens.
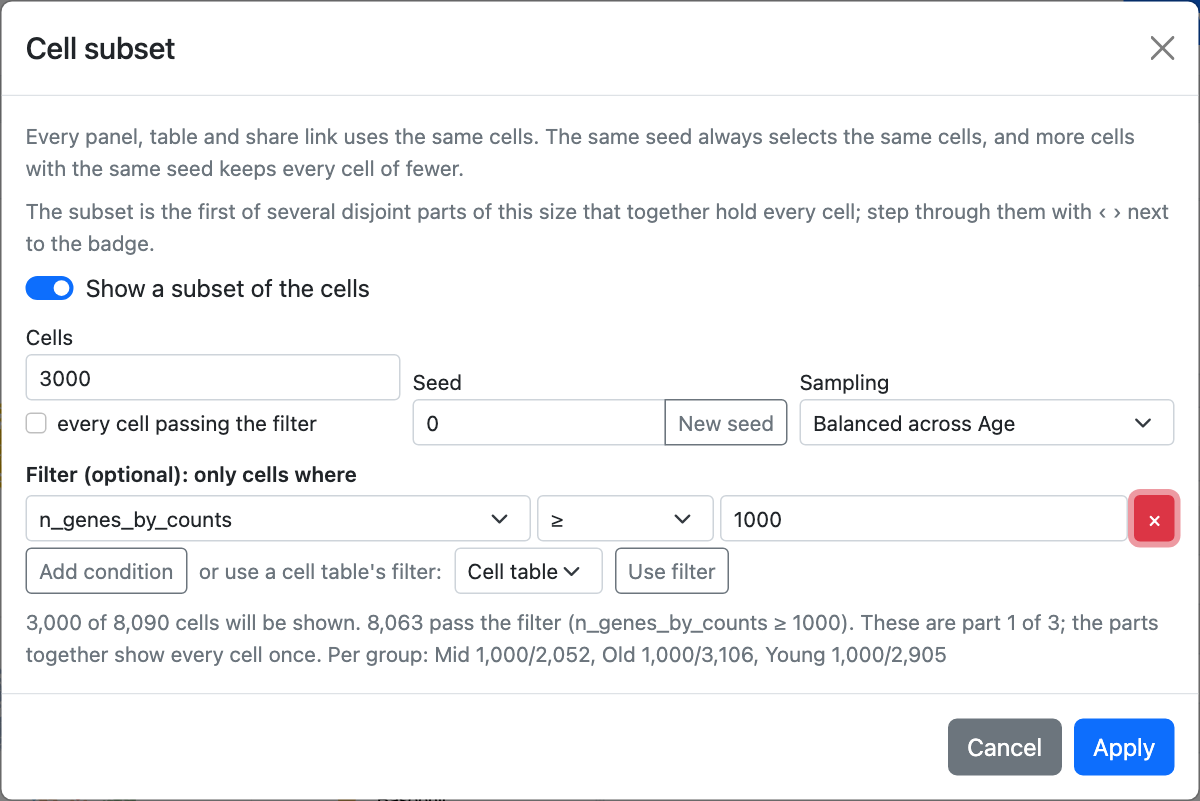
A balanced, filtered subset of 3,000 cells.
Switch on Show a subset of the cells (switch it off to show every cell).
Cells: how many cells to show, here
3000. Tick every cell passing the filter to keep all cells that pass the conditions below instead of a fixed number.Seed: any whole number from 0 to 4,294,967,295. New seed draws another one. The same seed always selects the same cells, and more cells with the same seed keep every cell of fewer: going from 50,000 to 100,000 cells adds cells and does not swap the ones on screen.
Sampling: Uniform, or Balanced across an obs column. Balanced sampling gives each group of that column an equal share where the group sizes allow; a group smaller than its share is taken whole and the rest is spread over the others. Here, Balanced across Age takes 1,000 cells from each of Mid, Old and Young.
Filter (optional): only cells where: click Add condition and choose an obs column, an operator and a value. Text columns offer “is one of” and “is not one of” (values comma separated); numeric columns offer >, ≥, <, ≤, =, ≠ and “between”. Conditions are joined by AND; a cell with a missing value passes no condition. Here,
n_genes_by_counts ≥ 1000. Use filter copies the filter of an open cell table instead (a top-level AND of conditions on obs columns; anything else is reported as not copied). Unlike the table, which only holds the cells already loaded, the subset applies the conditions to every cell of the dataset.The preview line under the form says how many cells will be shown, how many pass the filter and, for balanced sampling, how many are taken per group. It warns when the subset is so large that drawing it can make the browser slow.
Click Apply. Every panel reloads with the subset’s cells.
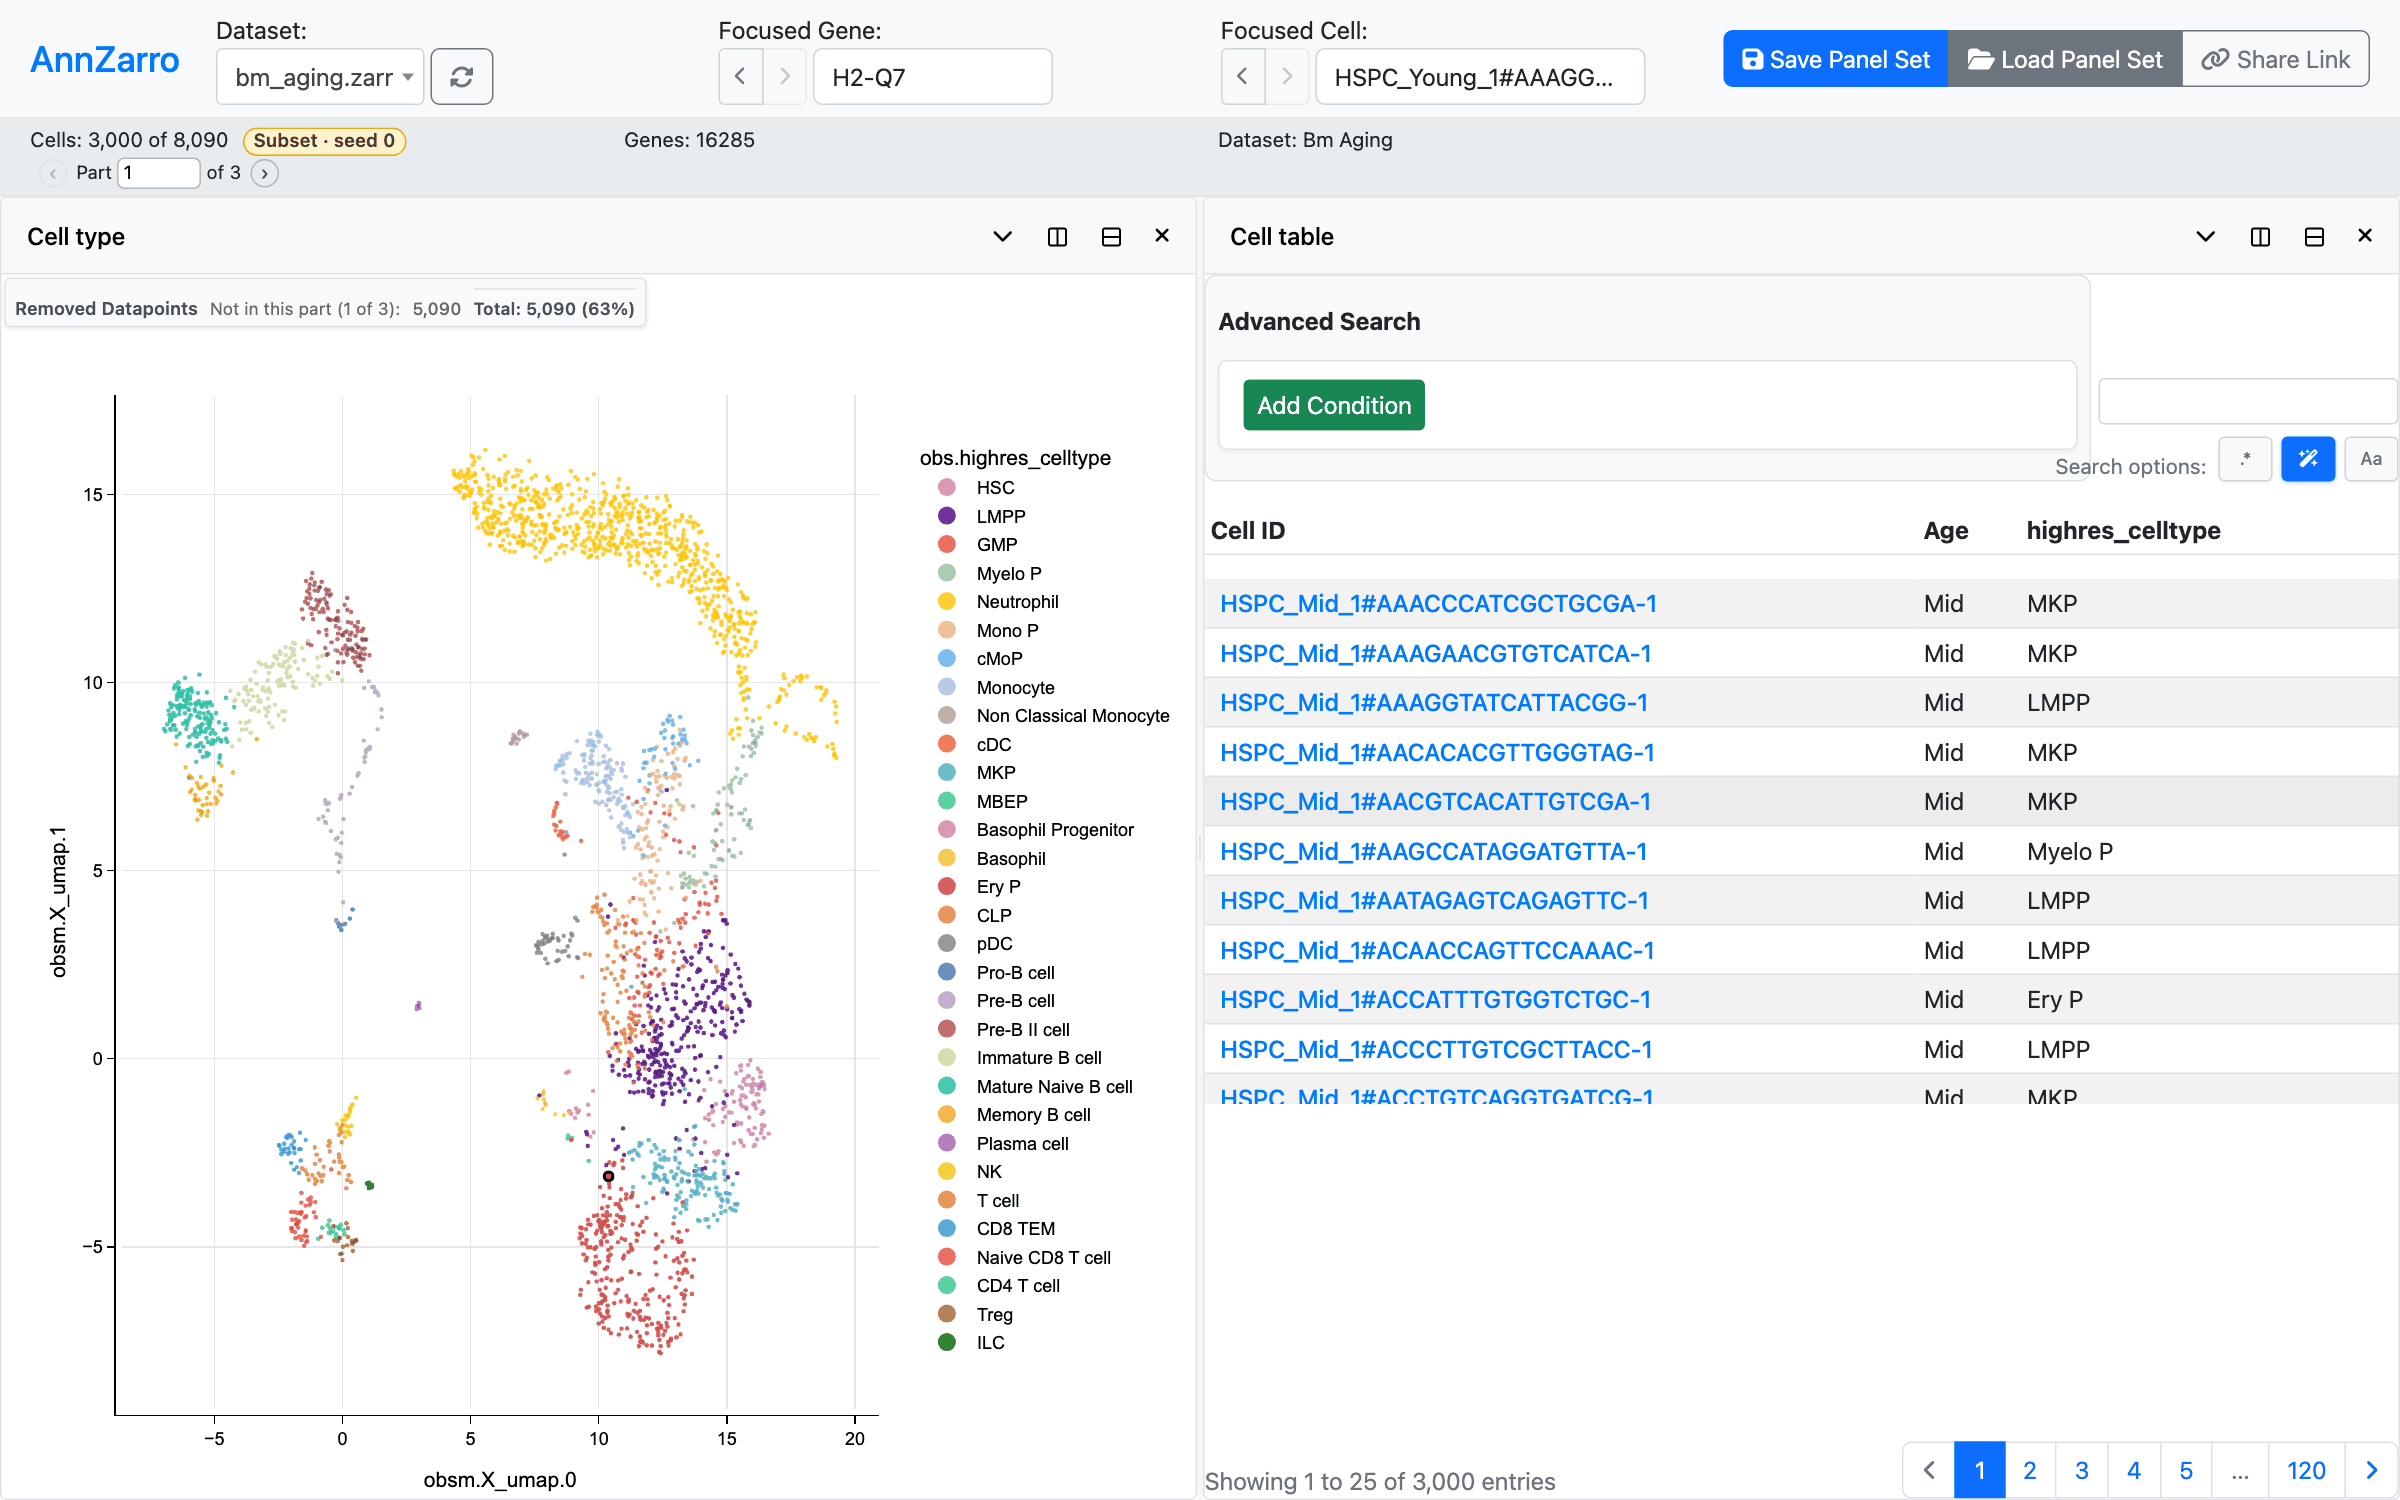
After Apply: the UMAP and the cell table show the same 3,000 cells. View before the subset:
userguide-subset-start.json.
Stepping through every cell
A subset is the first of several parts that split the cells into disjoint groups of the chosen size; together the parts hold every cell (every cell passing the filter) once. With more than one part, the statistics bar shows the part next to the badge:
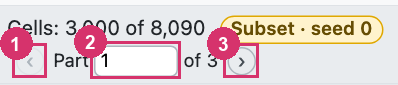
The 8,063 cells passing the filter above, in parts of 3,000: Part 1 of 3.
› (3) shows the next part and ‹ (1) the previous one. The view stays as it is (layout, panel settings, focused cell and gene, locks); only the cells change, and every panel and table follows. A focused or locked cell that is not in the new part stays focused or locked: its rows are still read, over the new part’s cells, and the header marks it not in part 2 of 3 (A focused cell outside the shown cells).
Type a part number into the box (2) and press Enter to jump to it.
The parts never share a cell: stepping from part 1 to part 3 shows each cell exactly once.
Share links and panel sets record the part, so they reopen on the same part. A link without a part, such as one made before parts existed, opens on part 1.
The same view on part 1 and, after one click on ›, on part 2:
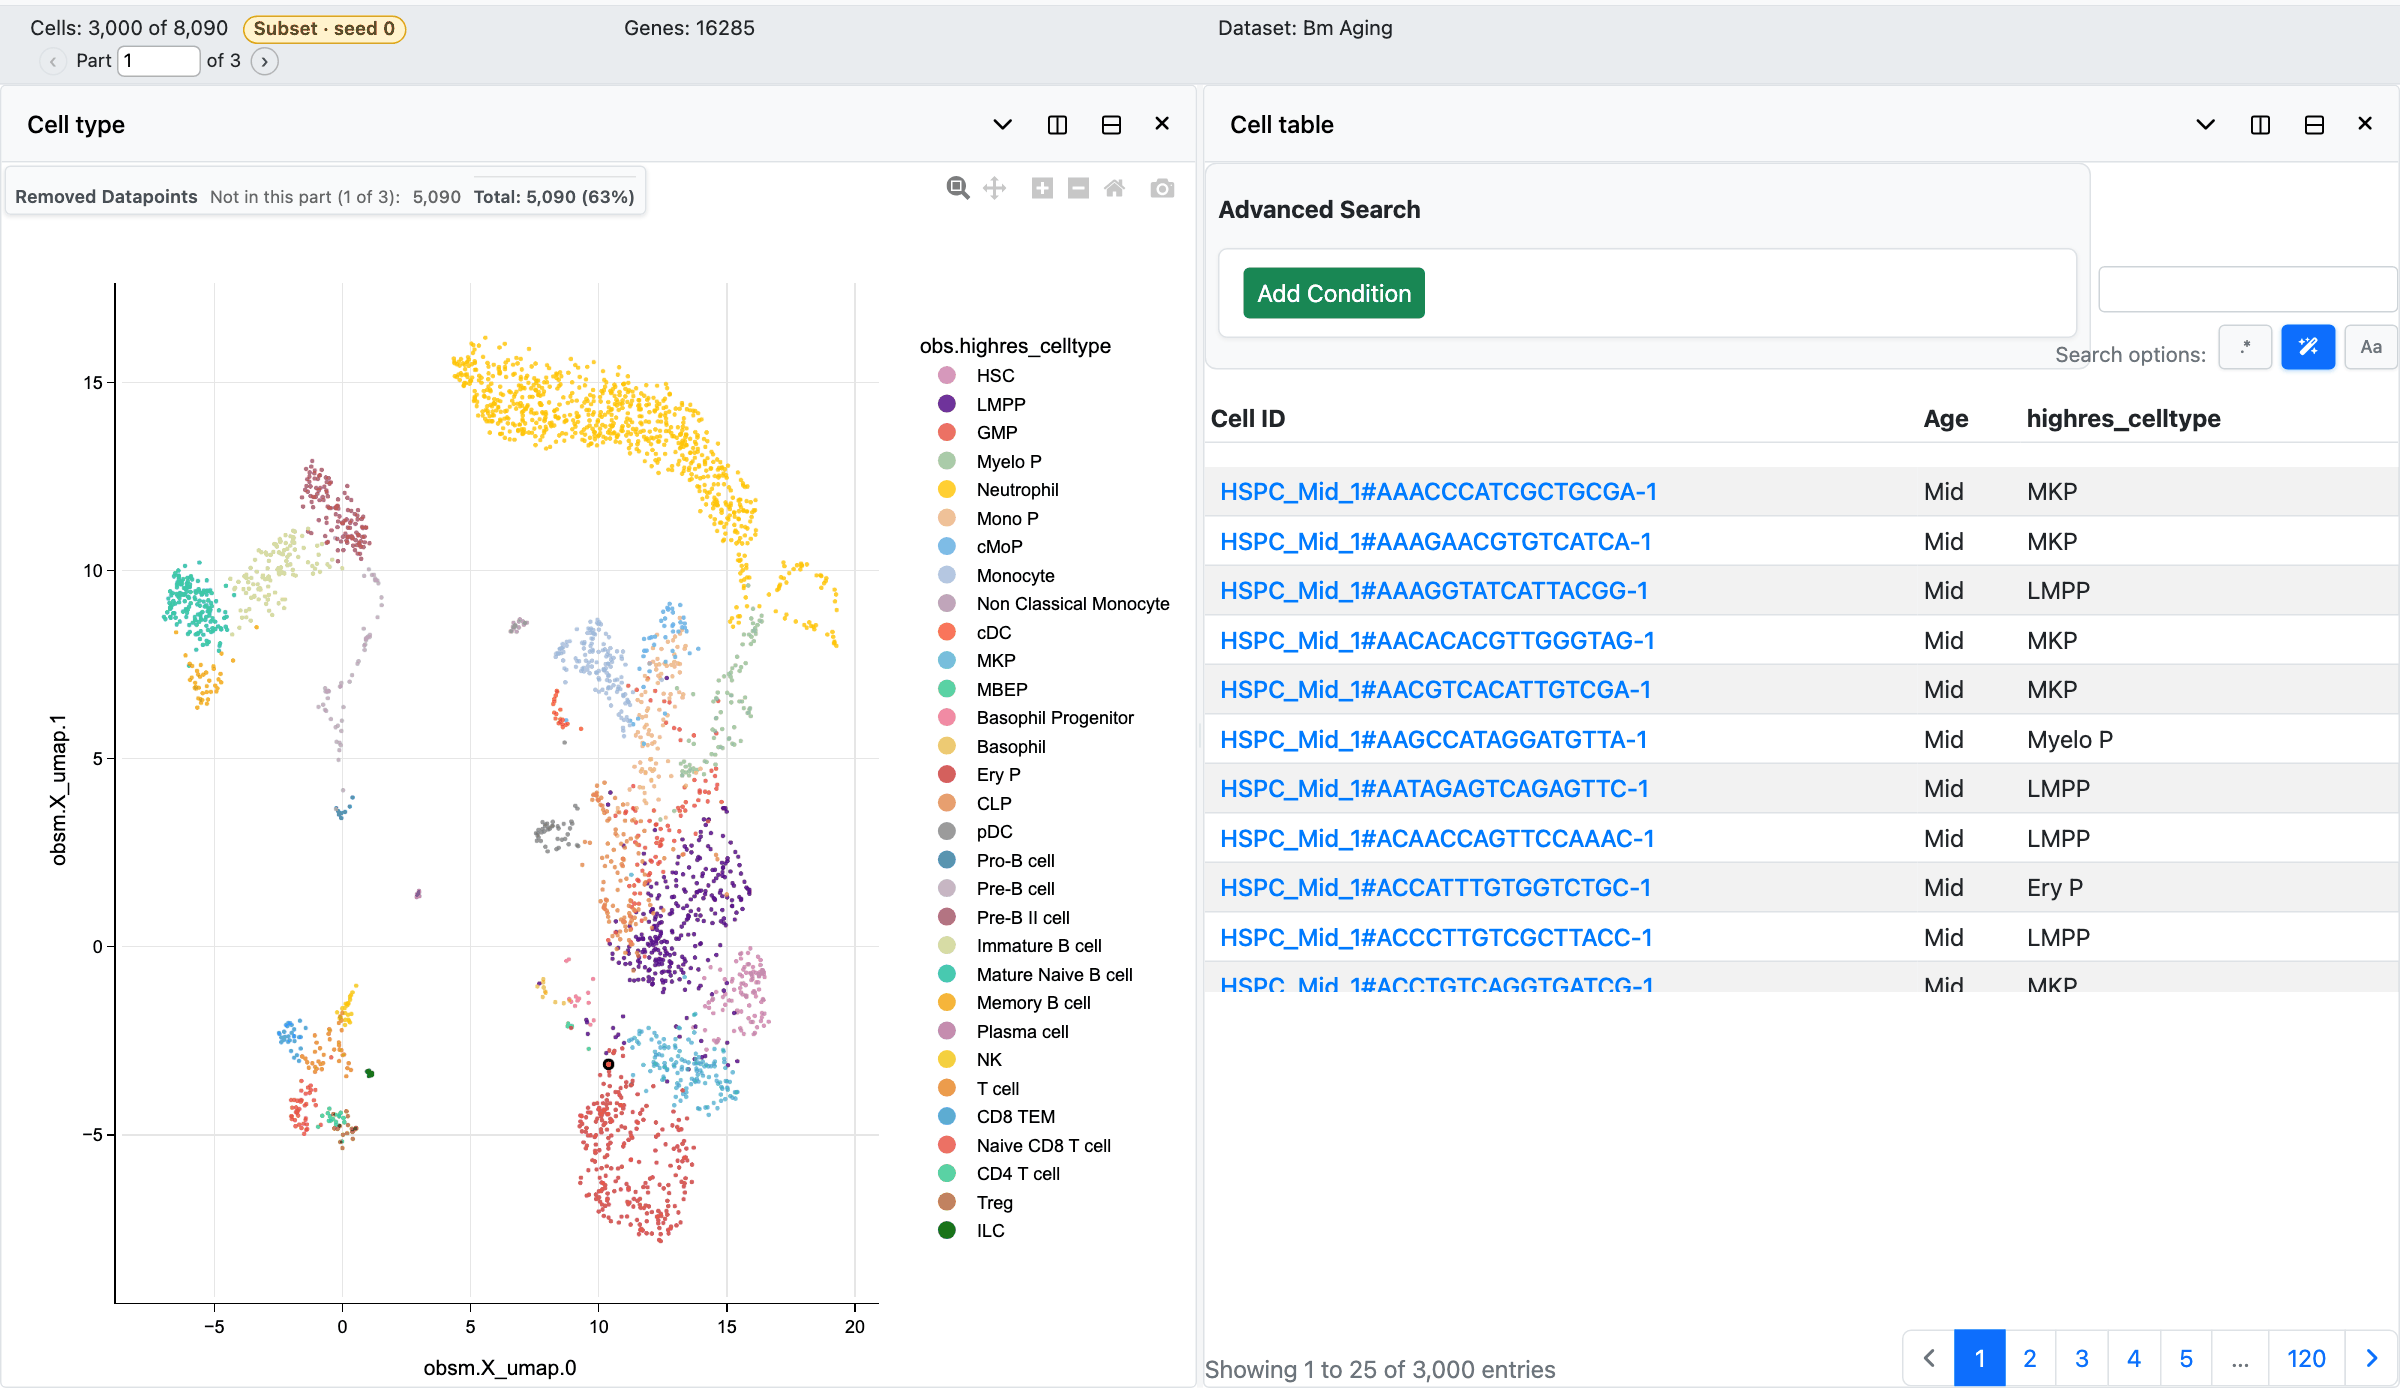
Part 1 of 3.
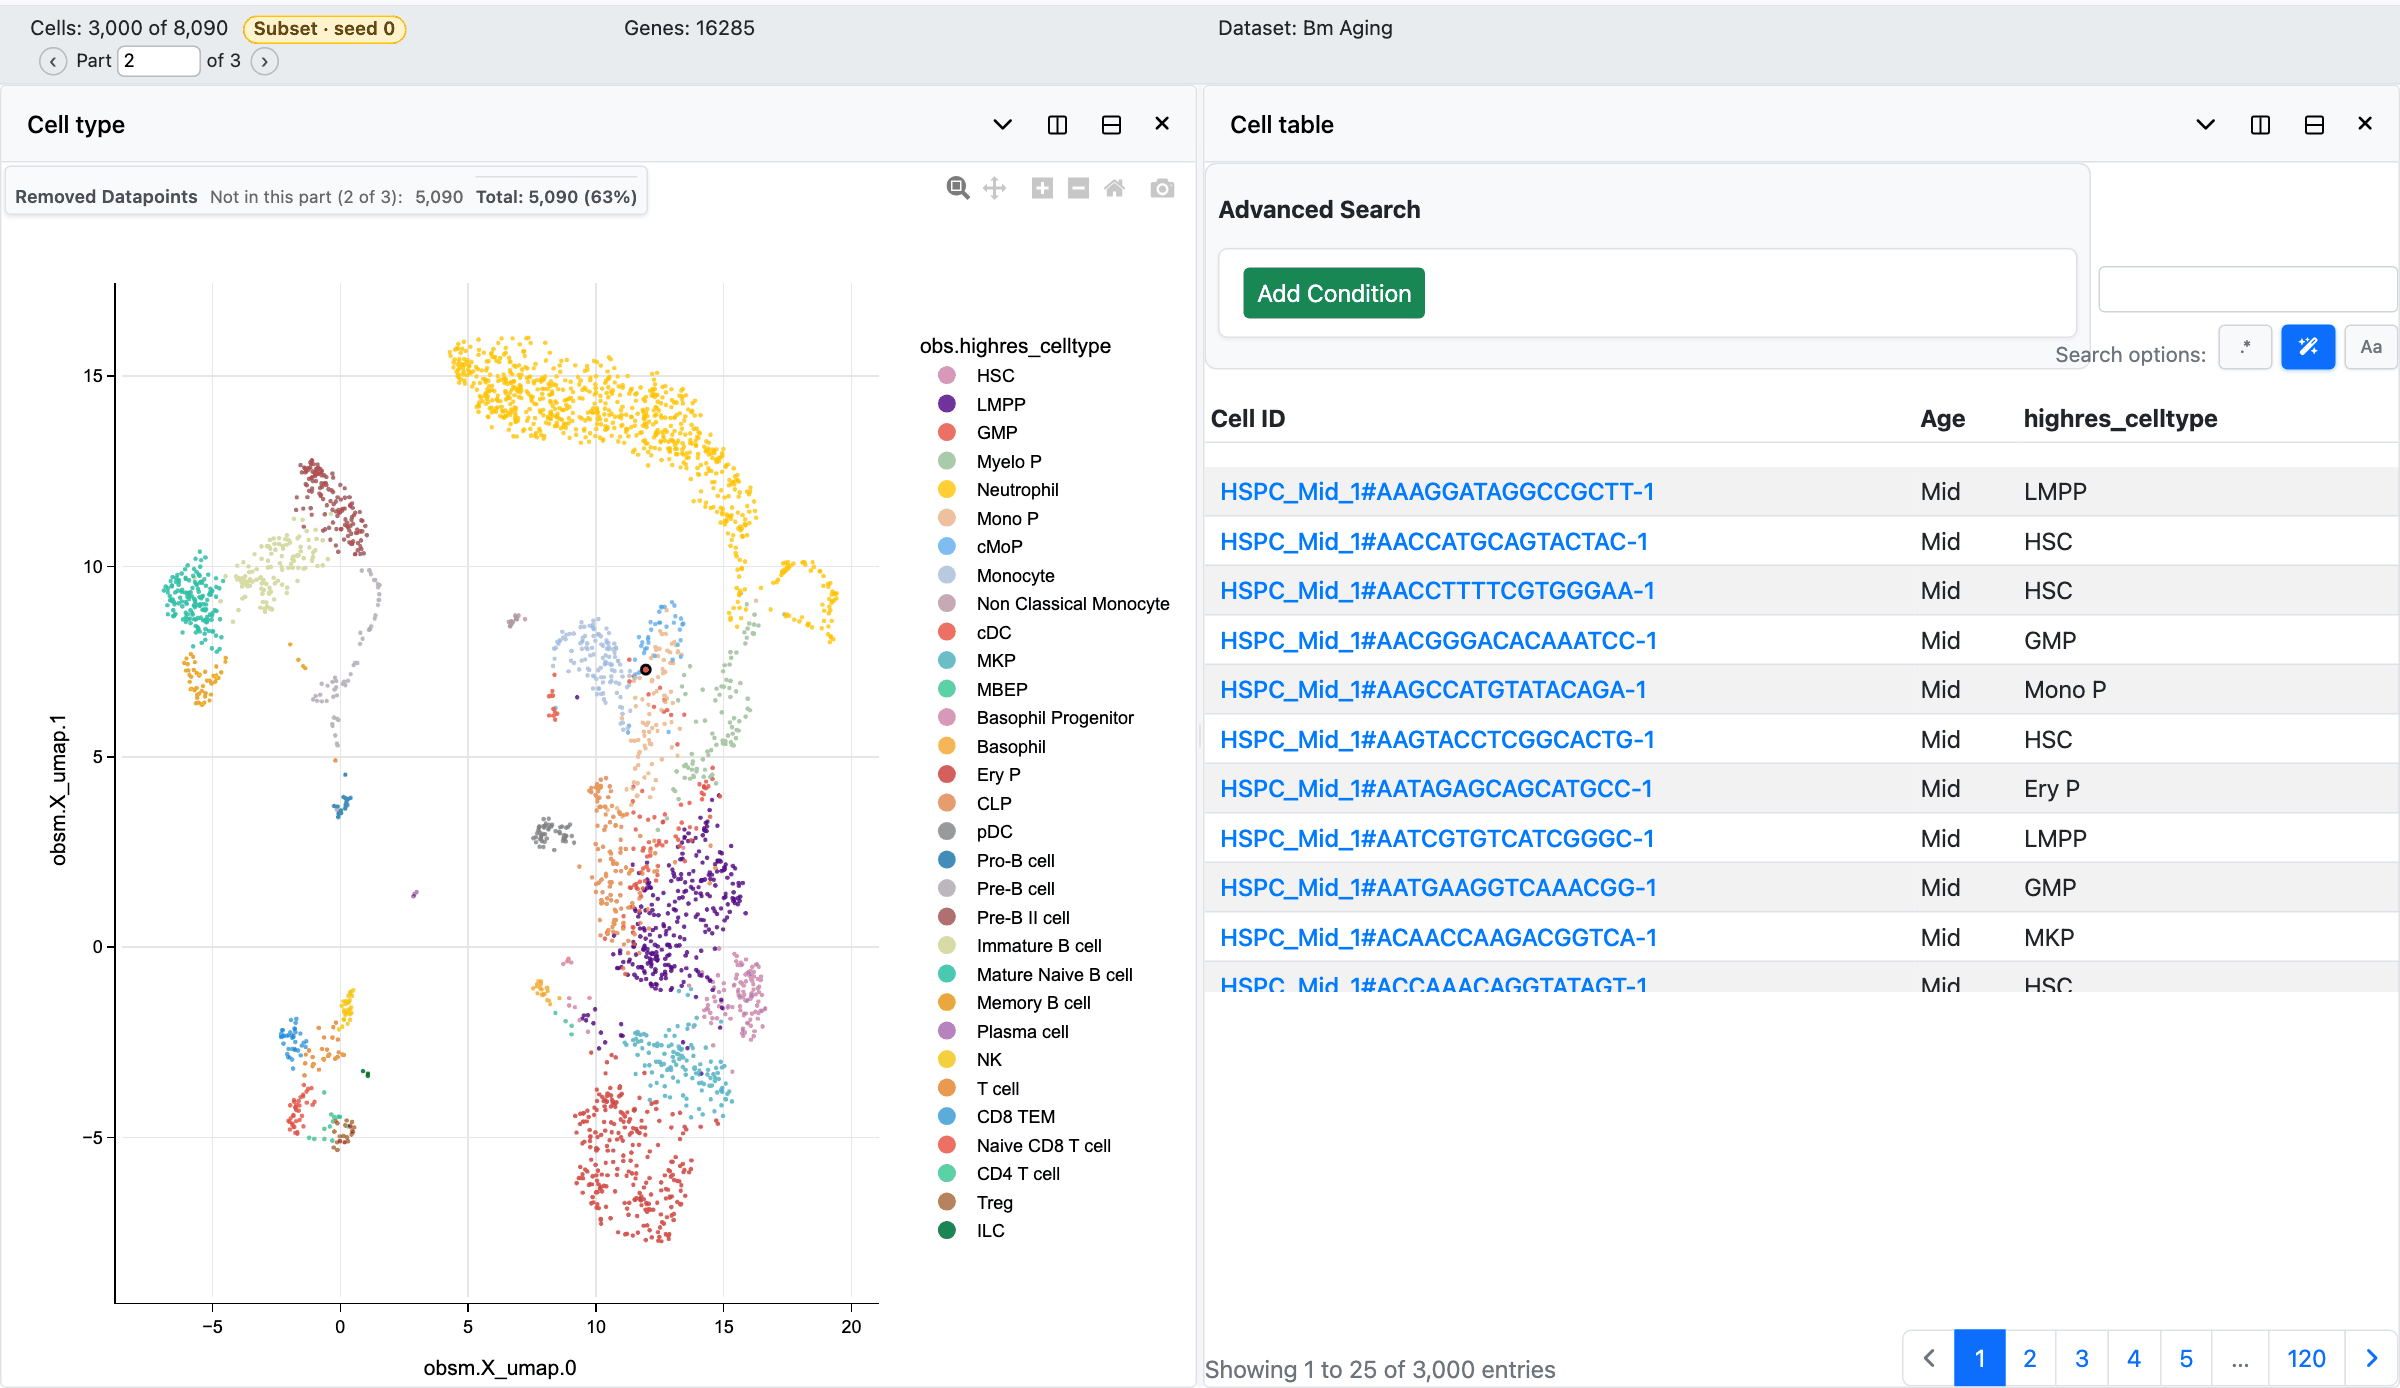
Part 2 of 3: other cells in the same layout. The table starts with different cells, the UMAP’s
points are a different 3,000, and Removed Datapoints counts the rest as “Not in this part
(2 of 3)”. View: userguide-subset-start.json
with the subset applied as above.
Balanced parts
With Balanced across a column, every part is as balanced as the cells not yet shown allow.
Small groups are used up in the first parts, so later parts hold the larger groups only. Here
bm_aging.zarr is split into nine parts of 1,000 cells balanced across highres_celltype (31
cell types). By part 7, 28 of them have been shown in full, and the part holds the three largest
types that still have cells left: LMPP, Neutrophil and Ery P. The badge’s tooltip says so:
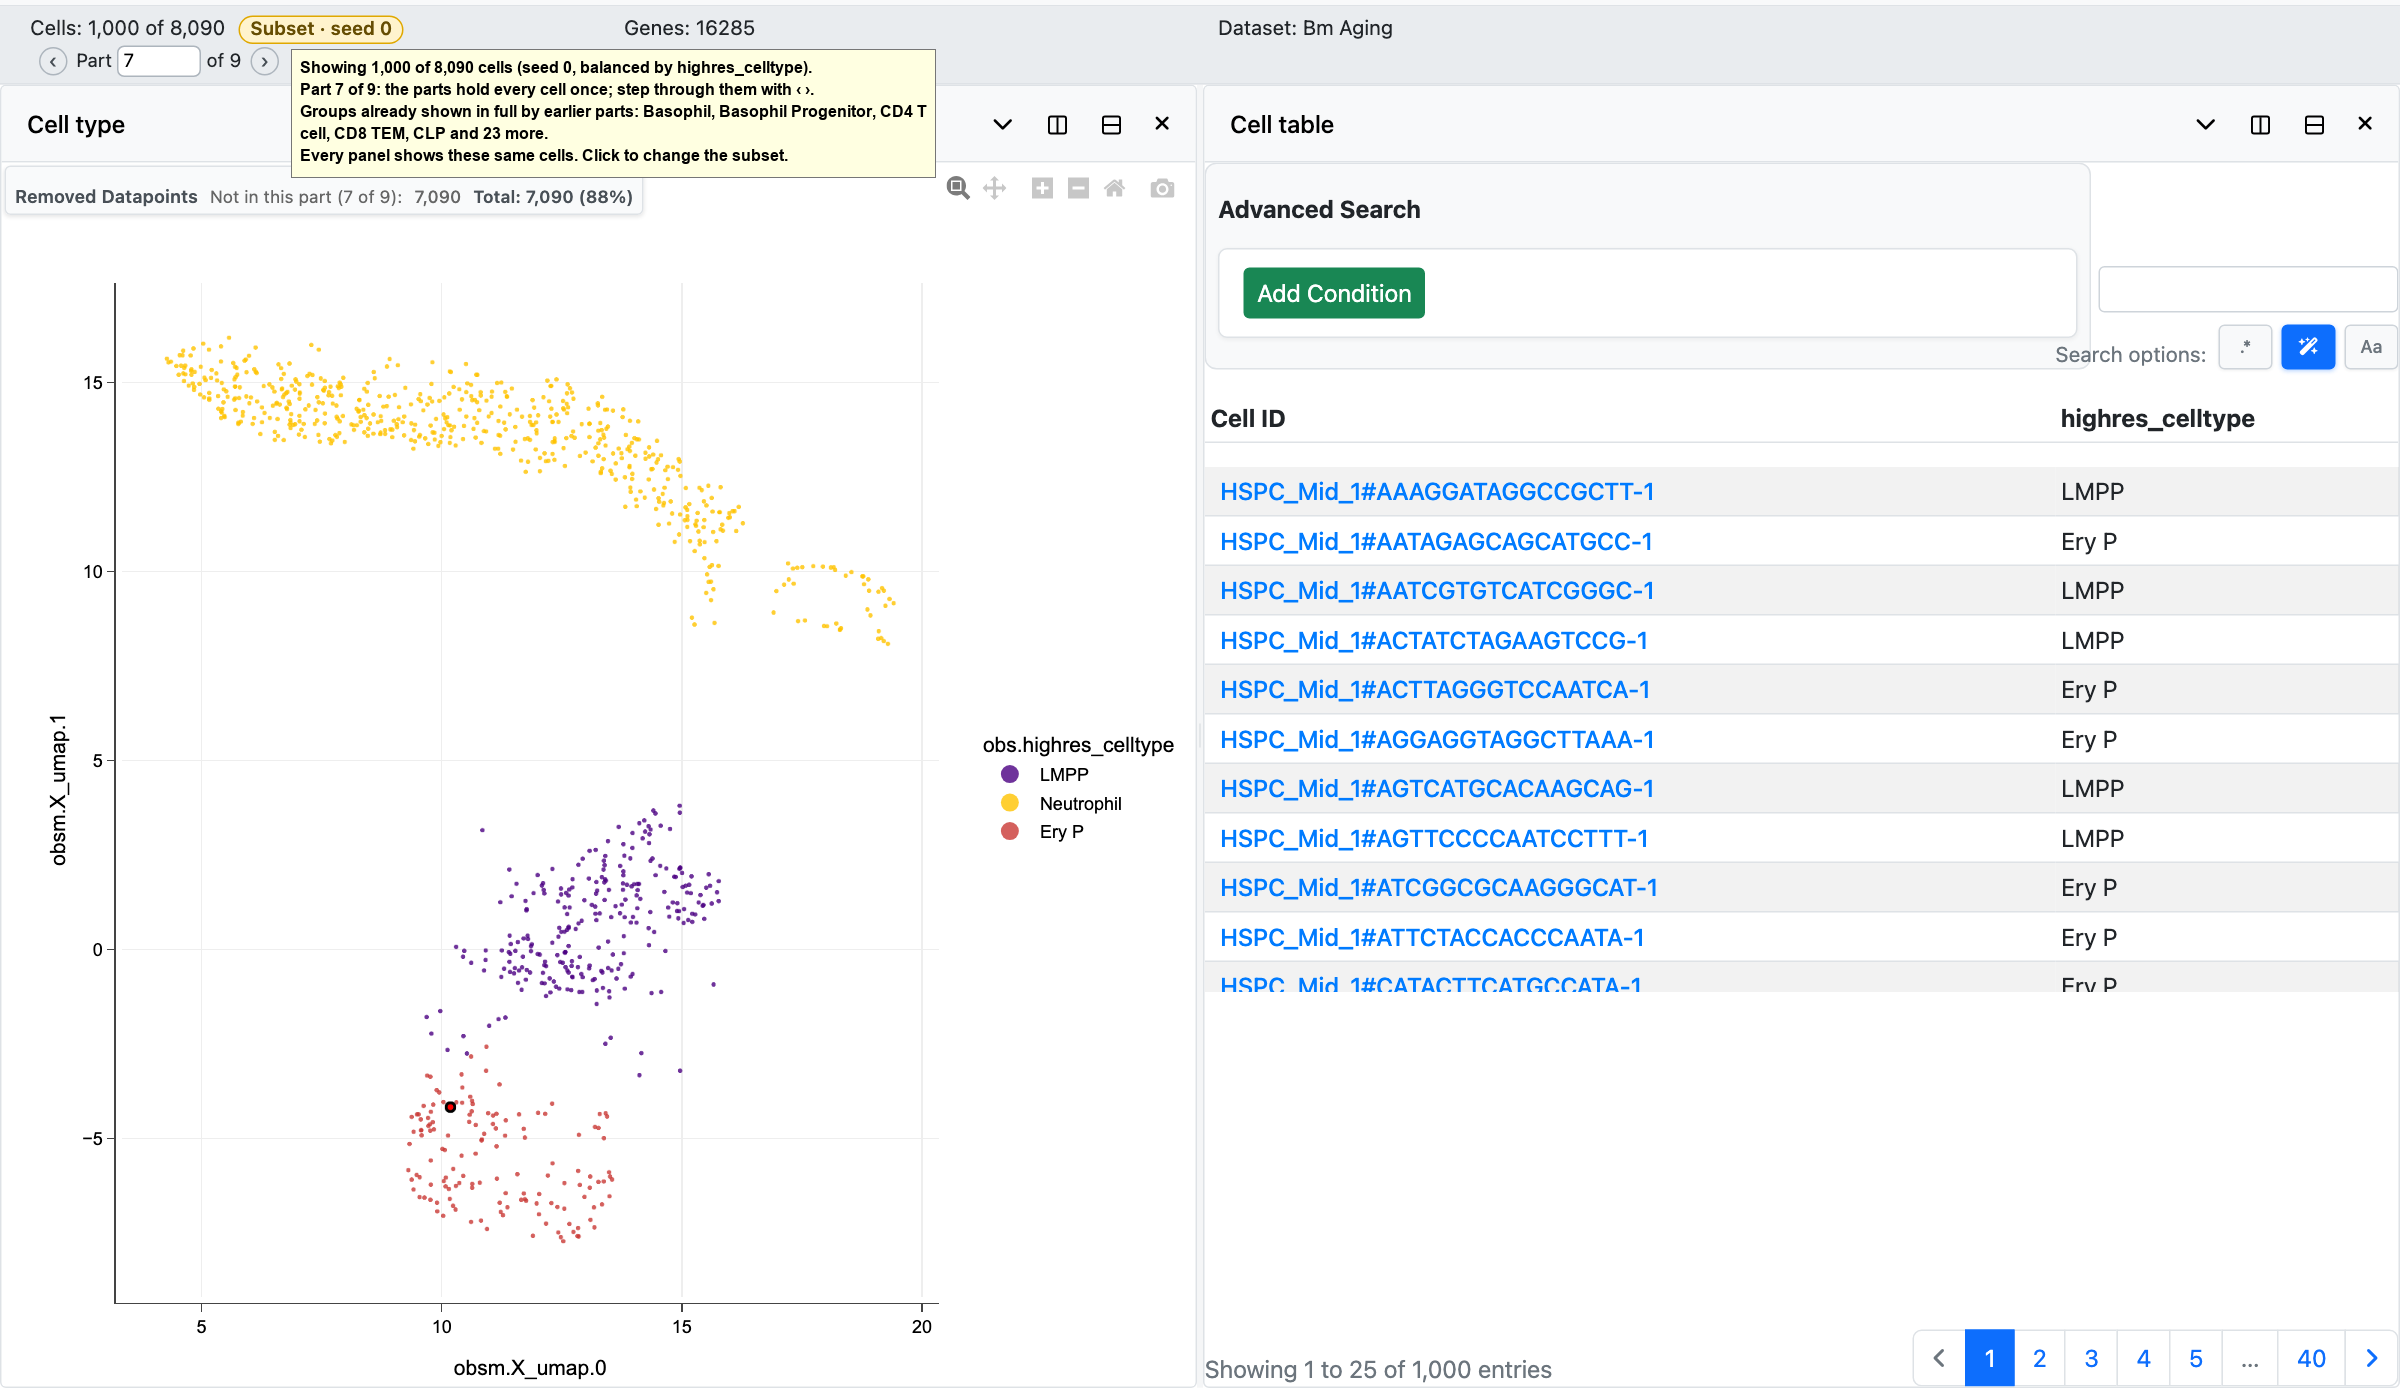
Part 7 of 9, balanced across cell type. The tooltip (drawn into the screenshot, because a
headless browser does not capture native tooltips; the text is the badge’s own) lists the cell
types earlier parts already showed in full. View:
userguide-subset-balanced-part.json.
What a subset changes
Cell plots draw only the subset’s cells. The Removed Datapoints box counts the other cells as not in this part of the cell subset (here 5,090, 63 % of 8,090), so its total always accounts for every cell of the dataset. Gene plots draw every gene as before.
Cell tables hold the subset’s cells (here 3,000 rows), and Export CSV writes those rows.
The Focused Cell picker finds every cell of the dataset. The subset’s cells are listed first; the others follow, tagged not shown, and can be focused too (A focused cell outside the shown cells).
Share links, panel sets and the autosaved view store the subset’s description, so they reopen on the same cells (a link to the subset above is 1,351 characters). A view saved with every cell of a large dataset records that and reopens with every cell; a view without a subset entry, such as an older link, opens with the server’s default.
The exact rule (a fixed hash of seed and row, so a notebook can reproduce the selection), the balancing algorithm and the request format are in Cell subsets for million-cell datasets.
Very large datasets
A Cell Plot is drawn in one of two ways.
Regular plot, up to 5 million points: everything on this page and in Cell plots and gene plots works, including hover, click to focus a cell, the focused-cell marker, table filters and 3D.
Large-plot mode, above 5 million points: that only happens with the subset removed (or larger than that) on a very large dataset. The limit is the server setting
ui.defaults.large_plot_points(Configuration).
The regular plot needs 400 to 900 bytes of the browser tab’s memory per point, and a tab gets about 4.4 GB whatever the browser settings, so a little above 5 million points it would close the tab. Large-plot mode keeps the points out of that memory and can draw the 95.6 million cells of Tahoe-100M on a laptop (Performance). In exchange it leaves out what needs per-point bookkeeping, and the panel says so above the plot:
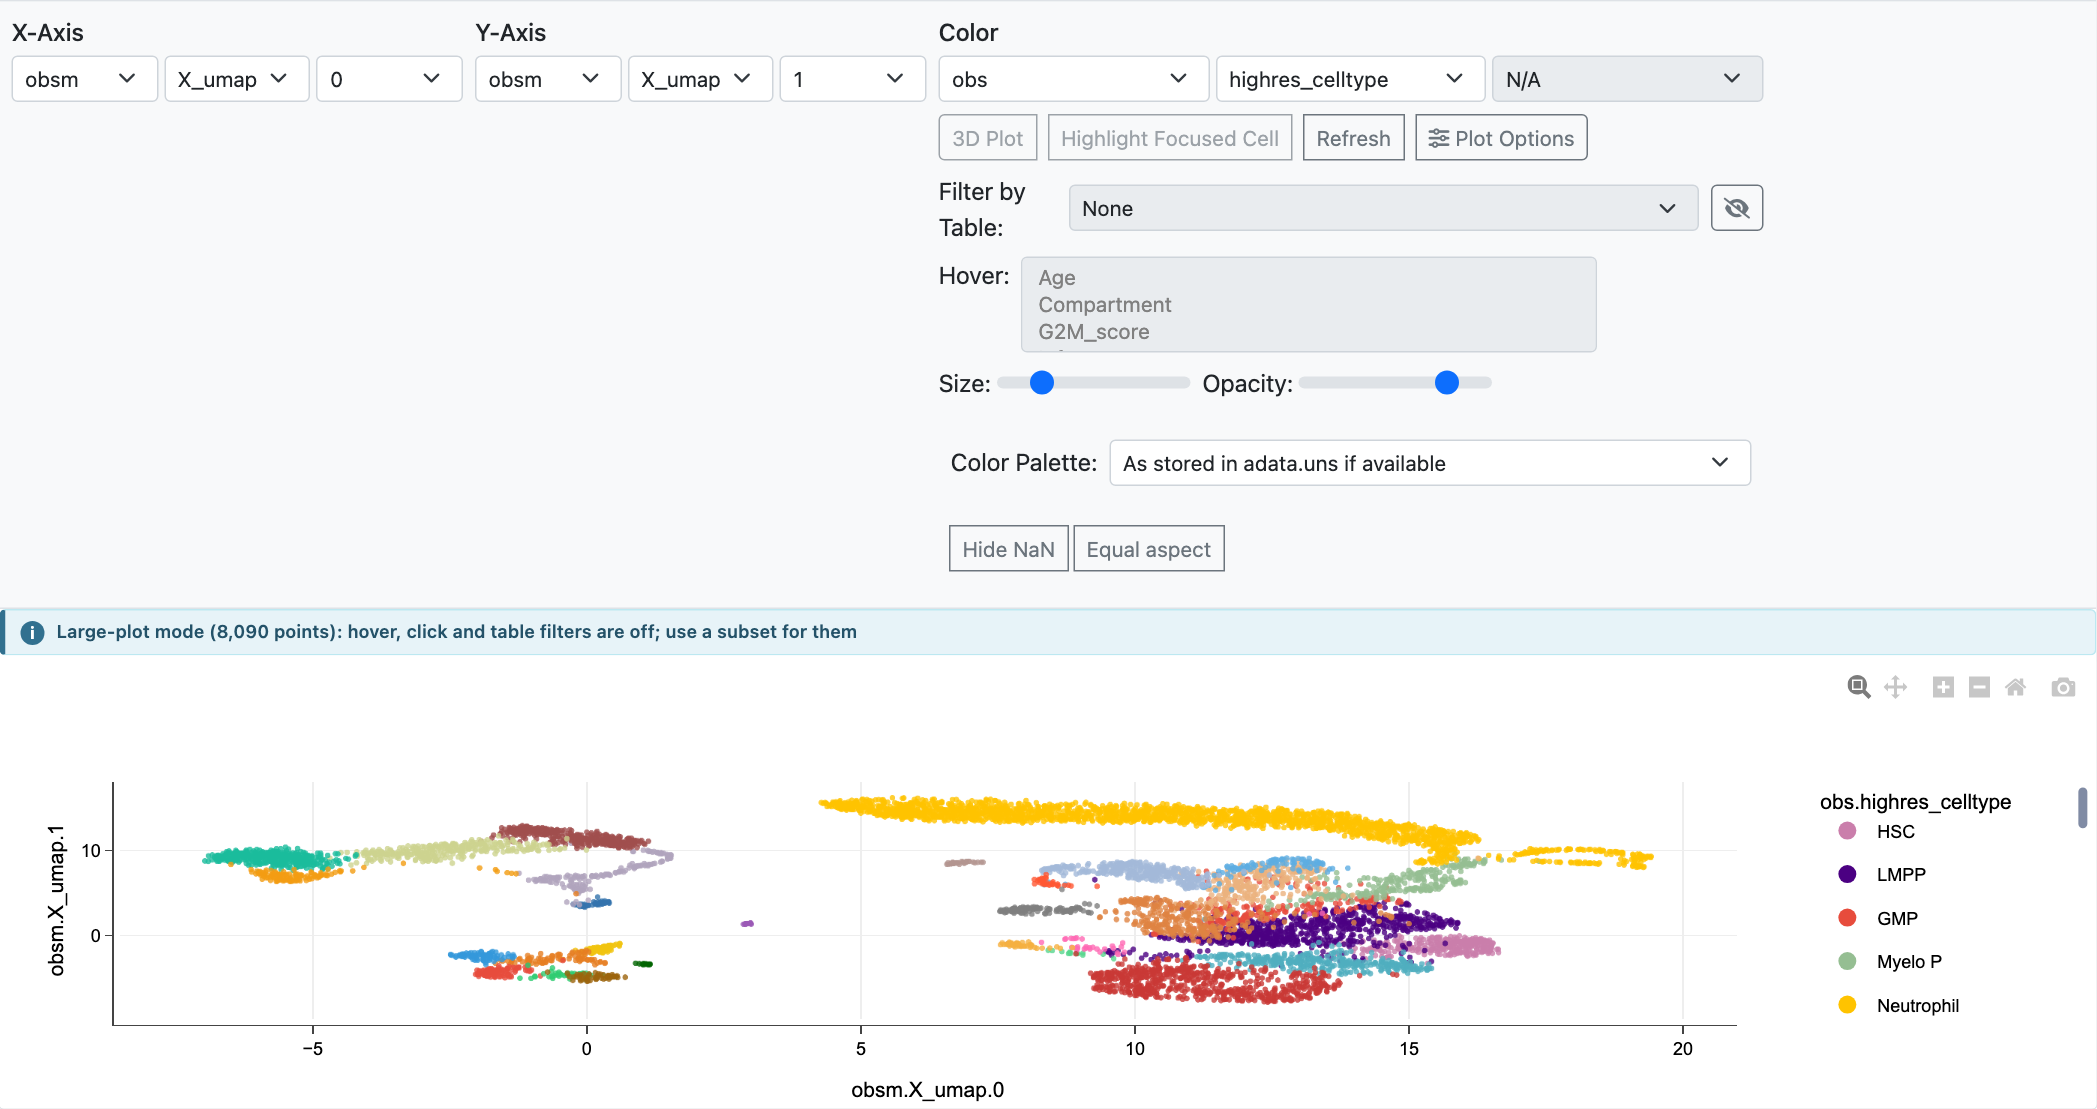
Every cell: large-plot mode. (Regenerated on the 8,090-cell demonstration store with the limit
lowered to 5,000; docs/_tools/shoot_large_plot.py.)
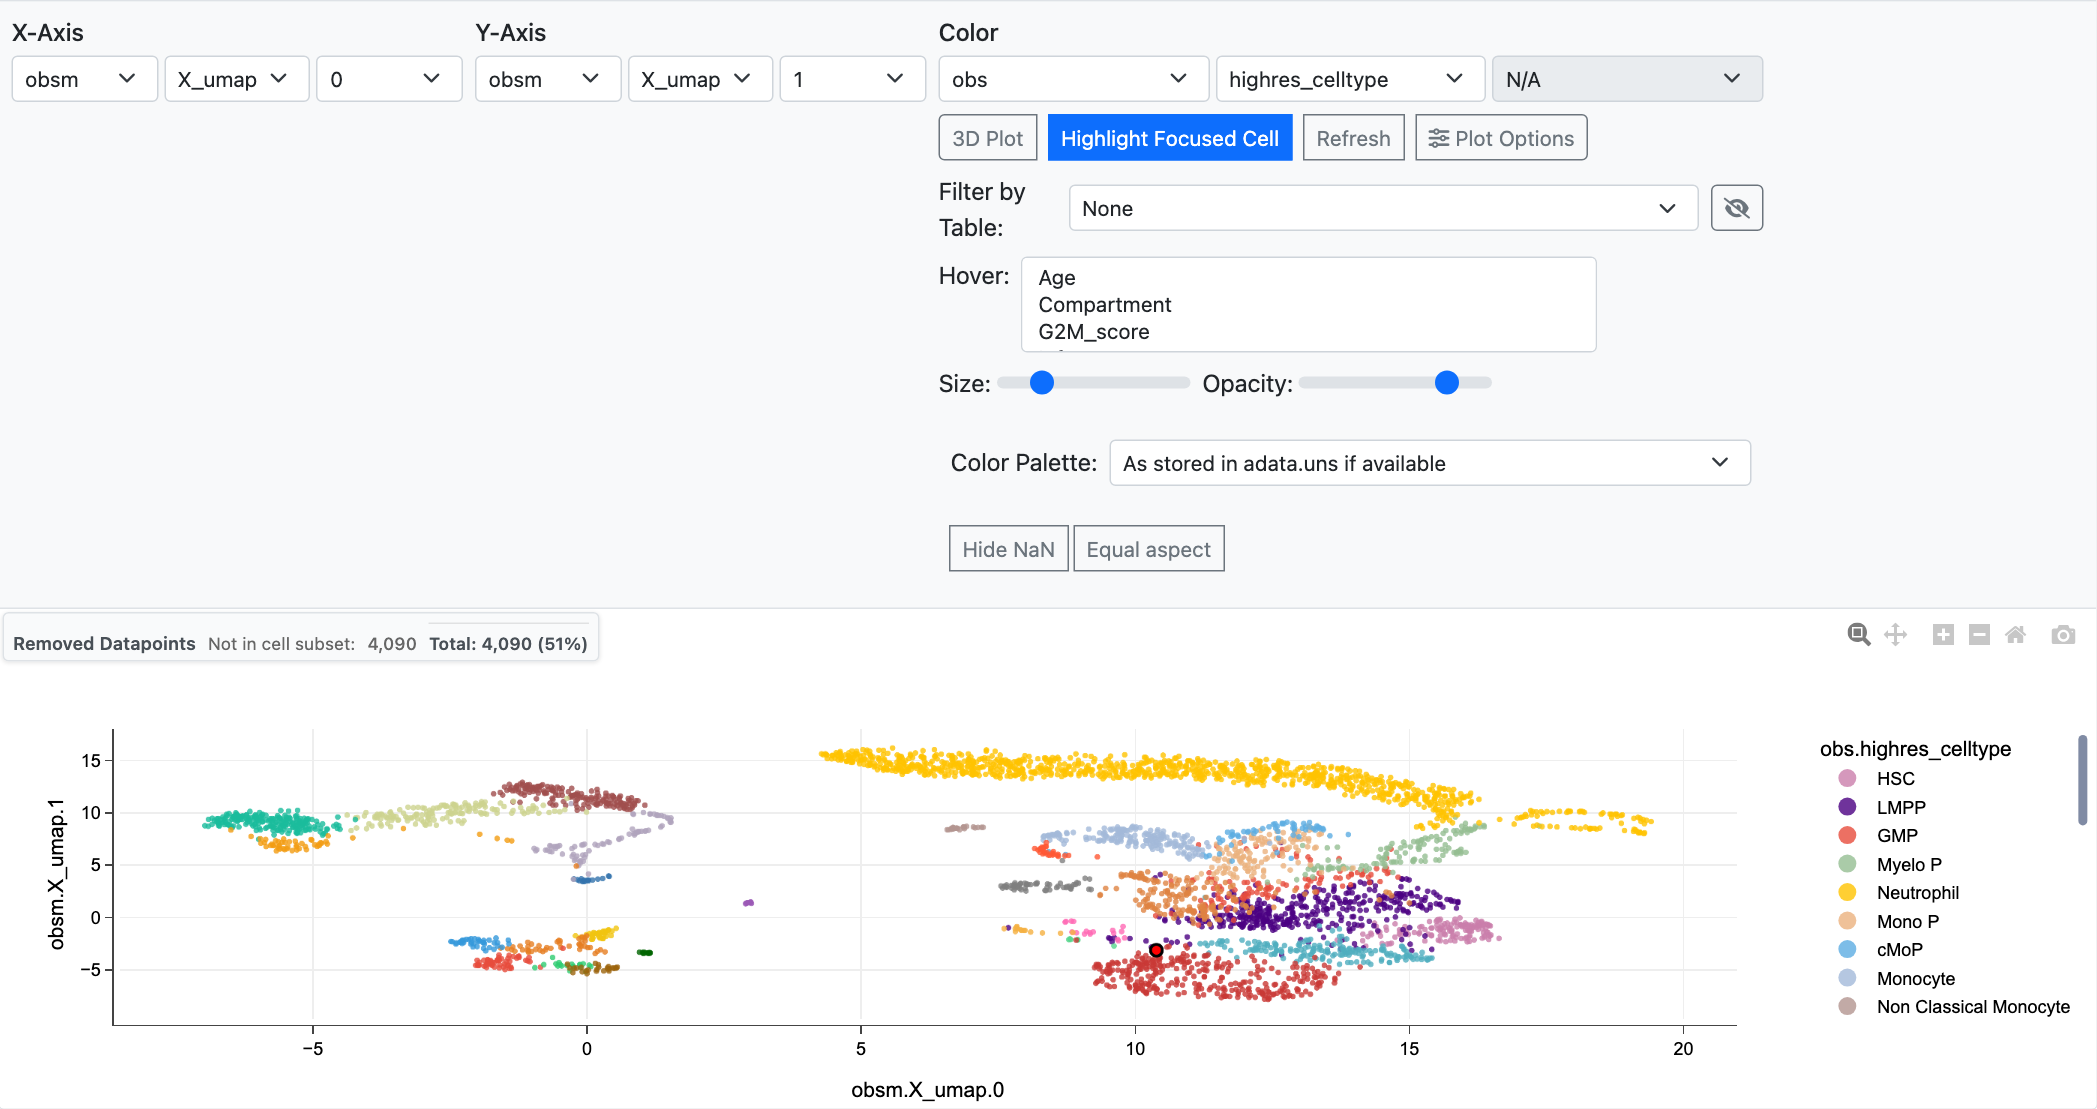
The same panel on a 4,000-cell subset: the regular plot.
In large-plot mode:
No hover and no click on points. Clicking a point does not focus a cell, and the focused cell is not marked.
Controls that would need the regular plot are off, with the tooltip “Not available above 5M points (large-plot mode); turn on a subset to use it”: the obsp axis and colour types, 3D and its z axis, the Hover list and the table filter.
Still available: pan and zoom; colour by a category (cell type, cluster, cell line), by a numeric obs column or by a gene, with the colour palette, scale and range; point size and opacity. A gene’s colour is drawn in 64 steps of the scale, the strongest values on top. Every change redraws the panel.
Categories are drawn interleaved. The regular plot draws each category whole, in the order of the legend, so where categories overlap the last ones cover the others. Large-plot mode draws them in pieces of under 100,000 points, mixed through the whole draw, so no category sits entirely on top. The same data can therefore look different in the two modes where categories overlap.
Cell names stay on the server. The dataset opens without downloading the names of its cells. Focusing a cell by name asks the server for it; on a dataset with tens of millions of cells the first such search waits while the server builds its name index (about 7 s for 50 million cells; a server running on your own computer builds it in the background as soon as the plot is drawn).
Settings it cannot draw are refused, not attempted. A view that asks for one, such as a share link colouring by an obsp row, shows a message instead of the plot: “Colour by an obsp column is not available for 95.6M points: turn on a subset, or choose an obs column or a gene”. A plot already on screen stays, with the message above it.
Turning a subset on (or one small enough) brings the regular plot back with hover and click. Removing it again returns to large-plot mode.
Measured on a large store
On a synthetic store of 1,160,000 cells (Apple M3 Max, Chromium, two UMAP panels, one coloured by a gene), measured when the subset was introduced:
Every cell |
Default subset (100,000 cells) |
|
|---|---|---|
Open the view |
17 s |
2 s |
JavaScript heap |
874 MB |
94 MB |
Recolour by another gene |
21 s |
1.3 s |
Most of the remaining 1.3 s is Plotly redrawing 100,000 coloured points.
What happens on the server
Every request on the cell axis (cell names, obs columns, obsm columns, obsp rows, a gene’s column of a layer) carries the subset’s description, a few dozen characters of JSON. The server turns it into the list of rows once (about 30 ms at 1.16 million cells for a uniform subset), keeps the result in a small cache, and reads only those rows. Here 8 of the 10 data requests after Apply carried the subset. Gene-axis requests (var columns, varp rows) are unchanged.